No history of trauma. No comorbidities. No prior surgeries.
Physical Exam
Edema of the left hip with restricted and painful range of motion of the left femoroacetabular joint.
Laboratory Tests
Alkaline phosphatase:591 U/L (40–129 U/L).
Remaining laboratory tests were normal.
Diagnostic Approach
Young adult + Acute hip pain and swelling + No trauma
Infections
Osteomyelitis
Septic Arthritis Infection-related laboratory tests within normal limits -> Rules out infectious causes
Tumors
Benign Tumors
Malignant Tumors
Elevated alkaline phosphatase -> Suggests bone involvement
Vascular
Deep Vein Thrombosis
Arteriovenous Malformation
A Doppler US was ordered to assess vascular involvement
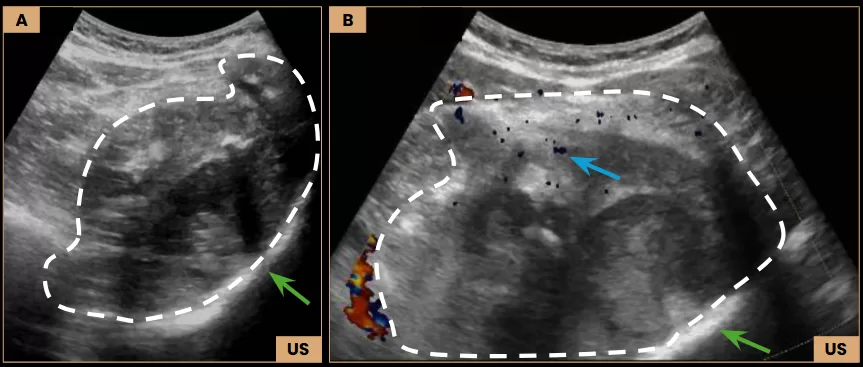
Diagnostic Imaging – Ultrasound
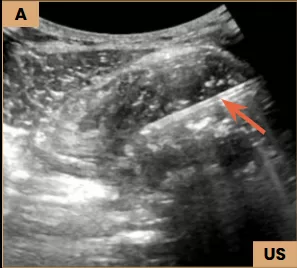
Images A and B: Ultrasound images show a large, heterogeneous expansile lesion (dashed line) located within the deep muscle planes and involving the left iliac bone (arrows – green), measuring 12.3 cm, with internal flow demonstrated on Doppler (arrow – blue).
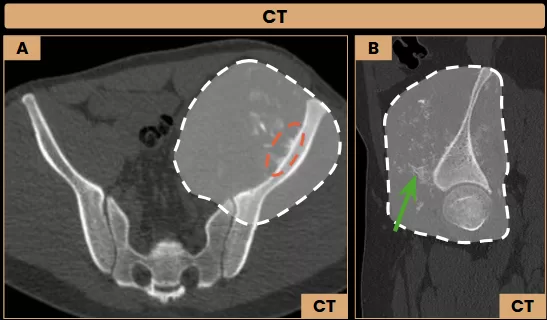
Diagnostic Imaging – CT and MRI
Images A and B: Axial and sagittal CT images (bone window) show a heterogeneous lesion centered on the left iliac wing, with an extensive soft tissue component (dashed line). The lesion presents interspersed calcifications/ossifications (arrow – green) and a sunburst periosteal reaction (dashed ellipse).
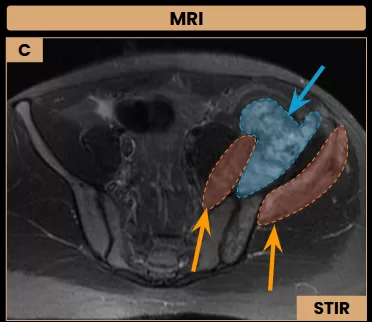
Image C: Axial MRI shows a necrotic area (arrow – blue) within the soft tissue component of the lesion, which also infiltrates the iliopsoas and gluteus minimus muscles (arrows – orange).
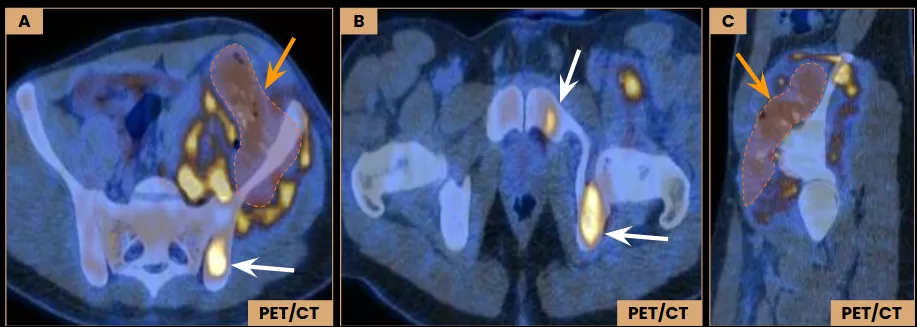
Diagnostic Imaging – PET/CT
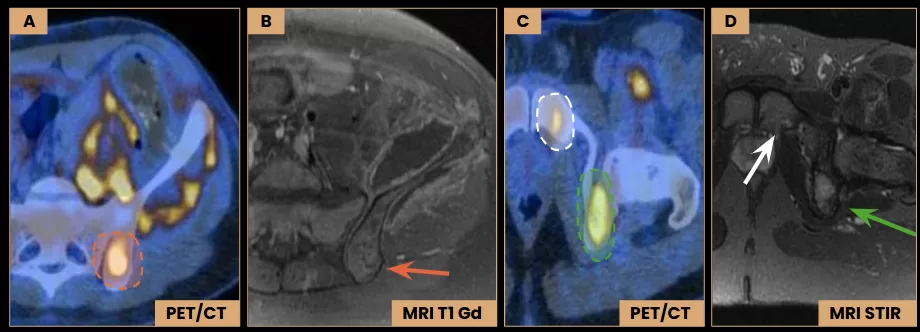
Images A – C: Axial and sagittal PET/CT images demonstrate FDG avidity of the lesion, with a maximum SUV of 12.4. Central areas of reduced uptake suggest necrosis (arrows – orange). Additional hypermetabolic foci are seen in the left iliac body, posterior aspect of the ischium, and ipsilateral pubic ramus (arrows – white). All of them without corresponding structural abnormalities on CT images.
Diagnostic Imaging – PET/CT and MRI
Images B and D: Axial MRI images show subtle enhancement in the left posterior iliac body (arrow – red), along with signal heterogeneity in the posterior aspect of the ischium (arrow – green) and in the pubic ramus (arrow). These findings correspond to hypermetabolic regions (dashed ellipses) identified on axial PET/CT images (A and C).
Differential Diagnosis
Young male adult with a lesion centered on the iliac bone with an extensive soft tissue component.
Primary malignant bone tumors
Biopsy and Histopathological Study
Ultrasound-Guided Biopsy
Image A: Ultrasound-guided biopsy using a Tru-Cut needle (arrow) obtained multiple soft tissue cores.
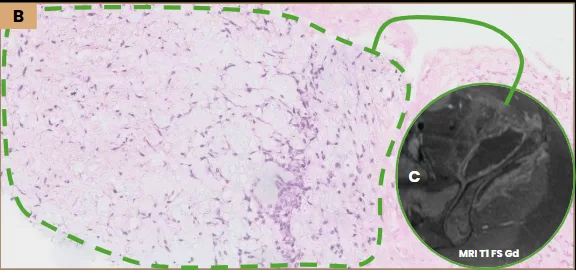
Image B and C: Histopathology revealed a myxoid matrix (dashed line) corresponding to the soft tissue component previously identified on MRI (arrow). The findings were suggestive of myxoid chondrosarcoma, pending molecular confirmation.
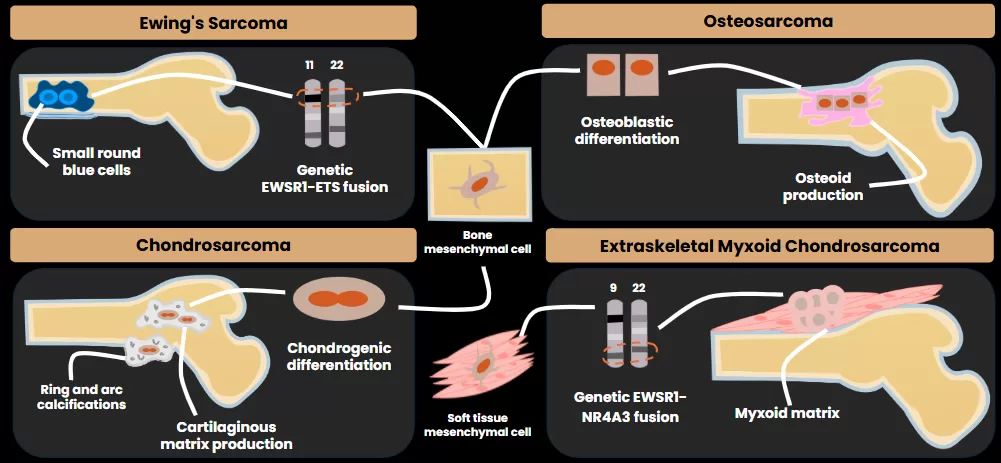
Teaching Point: Definitive diagnosis of myxoid chondrosarcoma requires molecular confirmation, typically identifying an EWSR1-NR4A3 fusion from the t(9;22)(q22;q12) translocation.
Treatment
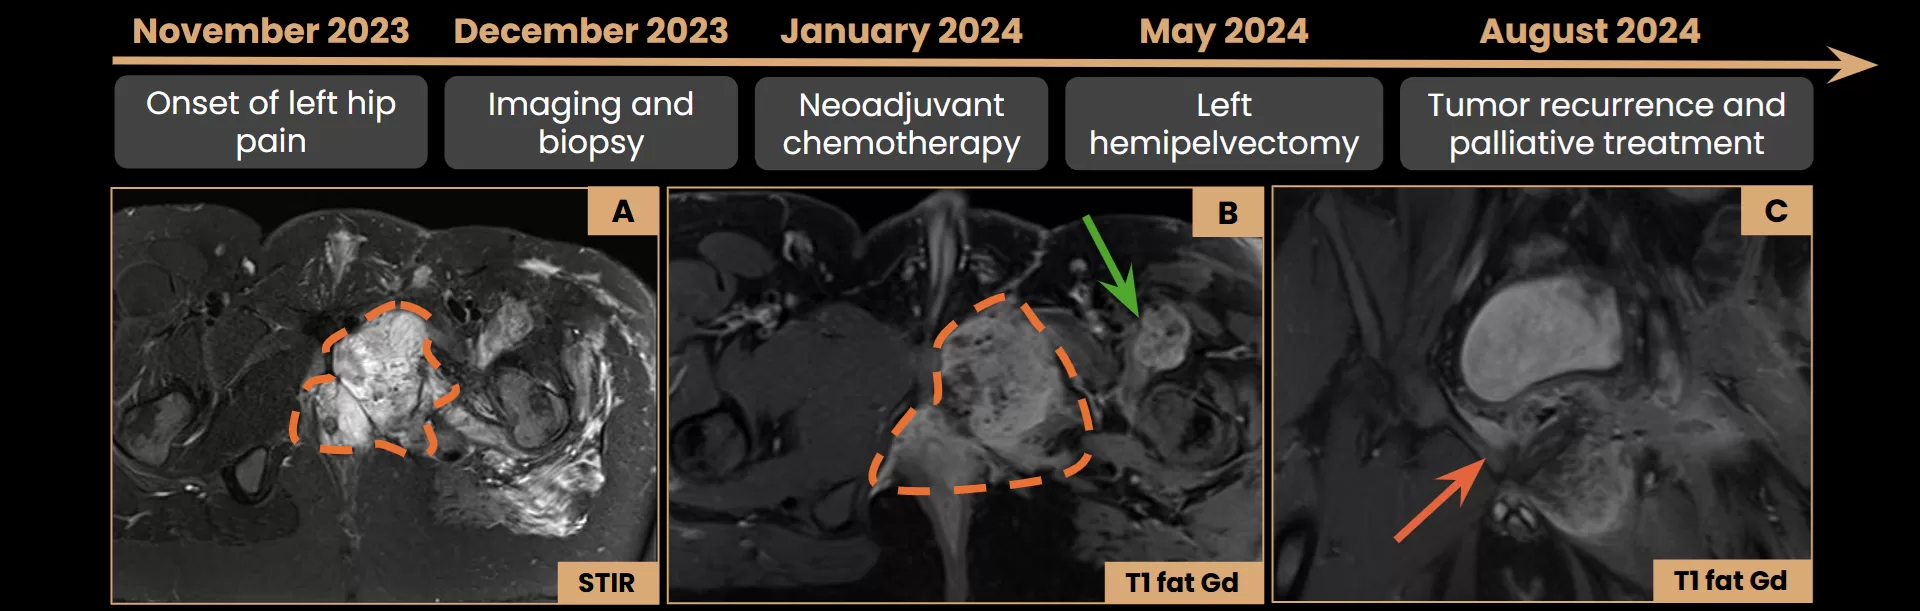
Neoadjuvant chemotherapy was initiated prior to diagnostic confirmation due to clinical deterioration.
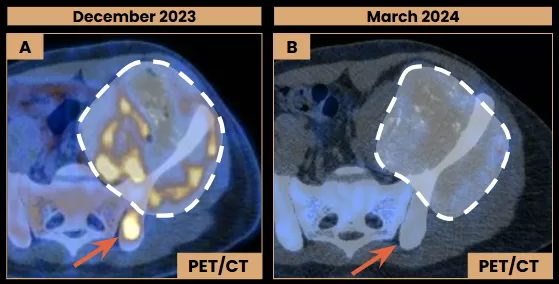
Post-chemotherapy findings after five treatment cycles.
Images A and B: Axial PET/CT images show a slight reduction in the soft tissue component of the lesion (dashed lines), with decreased FDG uptake (SUVmax 6.9, previous 12.4). The lesion in the left iliac is no longer FDG-avid (arrows).
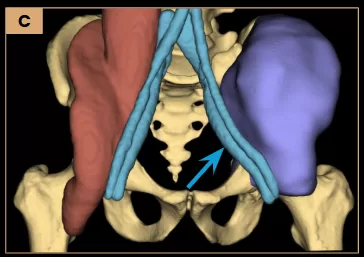
Left internal hemipelvectomy was performed with curative intent.
Image C: Schematic illustration for 3D model printing, highlighting the tumor in purple and its close proximity to the external iliac vessels (arrow).
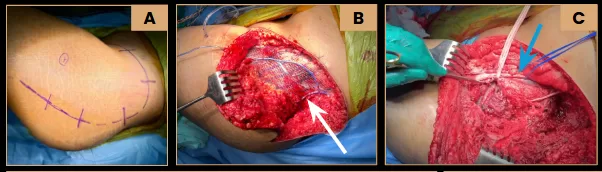
Surgery
Images A and B: Left internal hemipelvectomy with reconstruction using surgical mesh (arrow – white). Intraoperative video (C) highlights the close anatomical proximity of the tumor to the external iliac vessels (arrow – blue).
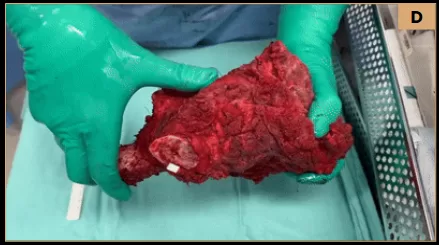
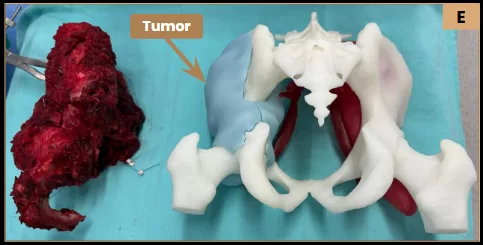
Surgical specimen video (D) demonstrating the tumor and its anatomical relationships.Image E: Posterior view of the surgical specimen alongside the 3D-printed model.
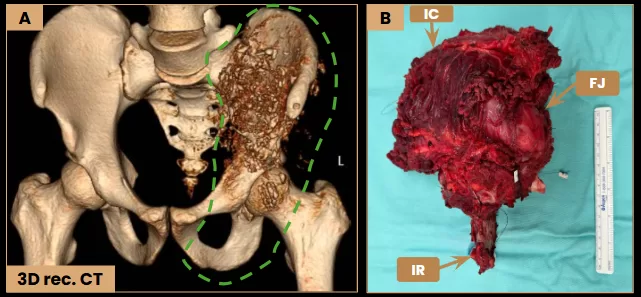
Image A: Preoperative 3D-reconstructed CT shows the tumor with soft tissue invasion. The dashed line indicates the resected area. Image B: Surgical specimen demonstrating the ischial ramus (IR), femoroacetabular joint (FJ), and iliac crest (IC).
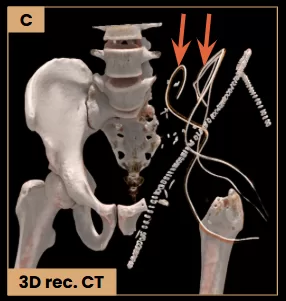
Image C: 3D-reconstructed CT demonstrates the hemipelvectomy with surgical drains (arrows).
Teaching Point: 3D models are valuable tools for surgical planning, particularly in cases of complex tumors.
From Pixels to Pathology: Diagnosing an Aggressive Hip OsteosarcomaMargrit Elis Müller, MDRadiology and Diagnostic Imaging Resident Orientador: Dr. Eduardo Noda Kihara Filho, MD
Instituição: Einstein Hospital IsraelitaFluorescence In Situ Hybridization (FISH) -> No EWSR1 generearrangement detected, ruling out Ewing’s sarcoma.Comprehensive Genomic Profiling Test -> Negative for EWSR1-NR4A3 fusion, ruling out myxoid chondrosarcoma.
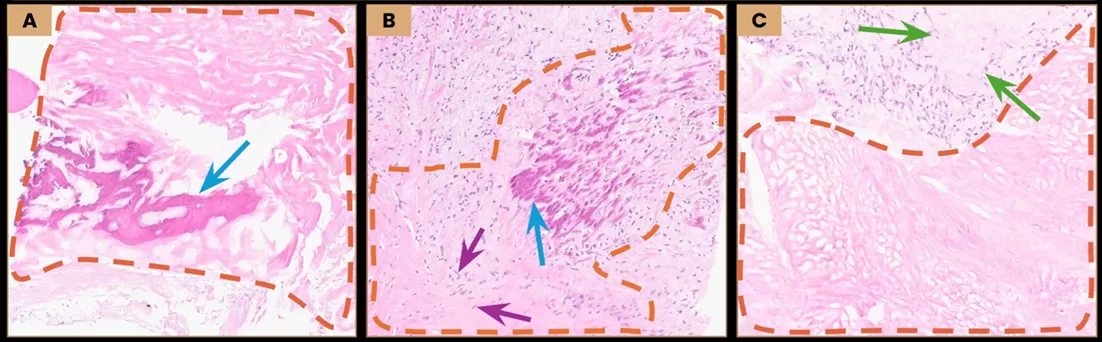
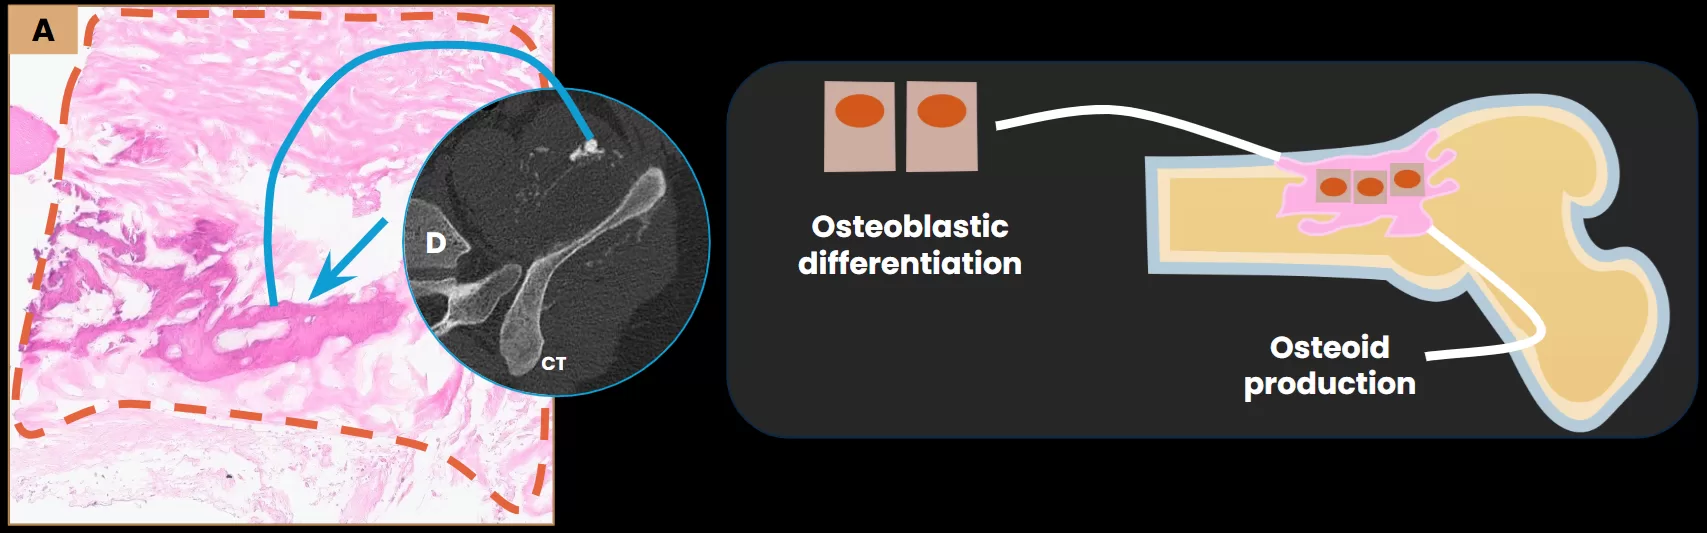
Osteoblastic Osteosarcoma
Images A–C: Histopathological analysis revealed necrotic osteoid (dashed line), calcified osteoid (arrows – blue), and nuclei of neoplastic cells (arrows – purple) alongside with the previously identified myxoid matrix (arrows – green). These findings confirmed a high-grade osteoblastic osteosarcoma of the left iliac bone (T4N0M0).Image D: Axial CT (bone window) shows intralesional calcifications (arrow), representing tumor matrix mineralization, which correlates with the calcified osteoid observed on histopathology.
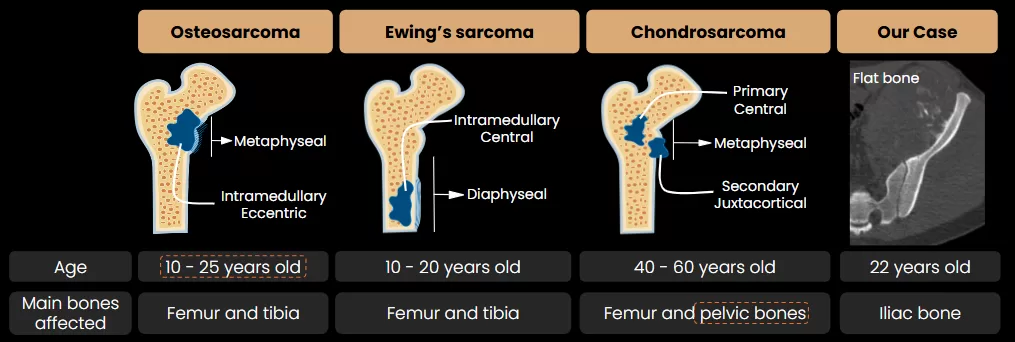
Malignant mesenchymal tumor characterized by osteoid production.
Most commonly involves the metaphysis of long bones.
Flat bone involvement is uncommon (8–11%) and typically associated with a poorer prognosis due to delayed diagnosis.
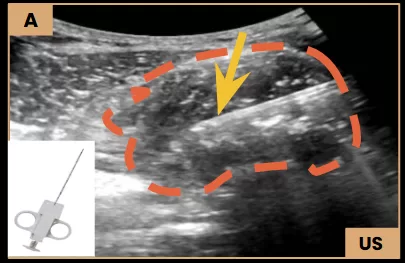
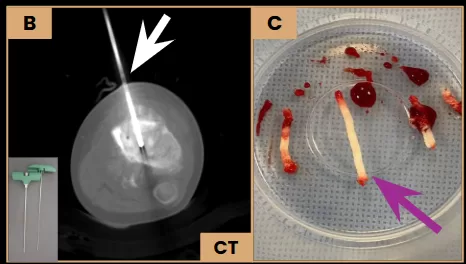
What Does This Case Teach Us?-> In lesions involving both bone and soft tissue, it is recommended to obtain biopsy samples from each component to improve diagnostic accuracy.
The diagnosis of osteosarcoma depends on identifying malignant osteoid cells, which may be absent in the soft tissue extension of the tumor.
Soft Tissue Biopsy Image A: US-guided biopsy showing the Tru Cut needle (arrow) sampling the soft tissue component (dashed line) of the tumor.Bone Biopsy Images B and C: Axial CT shows the bone biopsy needle (arrow – white) sampling the osseous component of a tumor in the left tibia, and the macroscopic bone fragments (arrow – purple).
Patient Outcome
Images A-C: Axial and coronal MRI demonstrate a lesion in the remnant of the left pubis with a large soft tissue component (dashed line) and a subtle infiltration of the right pubis (arrow – orange). A solid lesion is also noted in the soft tissues anterior to the left femoral amputation site (arrow – green). Findings are suggestive of tumor recurrence.November 2024: Patient received palliative care for refractory pain and passed away comfortably under supportive measures.
References
Murphey MD, Robbin MR, McRae GA, Flemming DJ, Temple HT, Kransdorf MJ. The many faces of osteosarcoma. Radiographics. 1997;17(5):1205–1231. doi:10.1148/radiographics.17.5.9308111
Yarmish G, Klein MJ, Landa J, Lefkowitz RA, Hwang S. Imaging characteristics of primary osteosarcoma: nonconventional subtypes. Radiographics. 2010;30(6):1653–72. doi:10.1148/rg.306105524.Bloem JL, Reidsma II. Bone and soft tissue tumors of hip and pelvis. Eur J Radiol. 2012;81(12):3793–3801. doi:10.1016/j.ejrad.2011.03.101.
Bloem JL, Reidsma II. Bone and soft tissue tumors of hip and pelvis. Eur J Radiol. 2012;81(12):3793–801. doi:10.1016/j.ejrad.2011.03.101.
Murphey MD, Senchak LT, Mambalam PK, Logie CI, Klassen-Fischer MK, Kransdorf MJ. From the Archives of Radiologic Pathology: Ewing Sarcoma Family of Tumors: Radiologic-Pathologic Correlation. Radiographics. 2013;33(3):803–831. doi:10.1148/rg.333135005
Benini S, Cocchi S, Gamberi G, et al. Diagnostic utility of molecular investigation in extraskeletal myxoid chondrosarcoma. J Mol Diagn. 2014;16(3):314-23. doi:10.1016/j.jmoldx.2013.12.002.